According to the Merriam-Webster Dictionary, the word "diagnosis" is defined as the act of identifying a problem by examining something; and a statement or conclusion that describes the reason for a problem.
One serious problem in the financial industry today is lacking a set of scientifically sound and easy to understand measuring standards for investors to uncover many flawed investment strategies sold to them. Informed investors must learn how to measure the added value, if any, of their investment advisory to prevent losses due to wrong claims and unjustified fees.
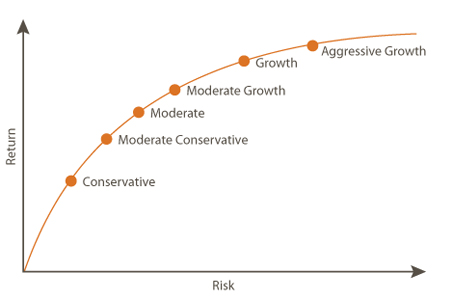
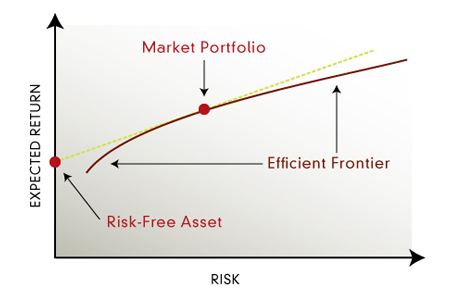
At present, many investors are still facing inconsistent and misleading information presented by financial firms and their advisors. For example, the two charts shown below are a portfolio benchmark line (left) and the efficient frontier line (right). Investors are unaware that an actively managed portfolio can outperform the benchmark line (left). The confusion is caused by that many advisors mistakenly apply efficient frontier (right) as the actual benchmark line for portfolio evaluation.
At present, many investors are still facing inconsistent and misleading information presented by financial firms and their advisors. For example, the two charts shown below are a portfolio benchmark line (left) and the efficient frontier line (right). Investors are unaware that an actively managed portfolio can outperform the benchmark line (left). The confusion is caused by that many advisors mistakenly apply efficient frontier (right) as the actual benchmark line for portfolio evaluation.
|
|
Remarks: Even the above two lines look alike, they are plotted with two sets of different data. The portfolio benchmark line (left) is the performance achievable with passive allocations of indexes, while the efficient frontier line (right) is a theoretical maximum achievable performance line under a set of assumptions as predicted by the modern portfolio theory (MPT).
Maximum Drawdown (MDD)
|
Maximum Drawdown (MDD)Maximum Drawdown (MDD) is an indicator of the risk of a portfolio chosen based on a certain strategy. It measures the largest single drop from peak to bottom in the value of a portfolio (before a new peak is achieved). MDD offers investors a worst case scenario. It tells the investor how much would have been lost if an investor bought at the absolute peak value of an investment, rode it all the way down, and sold at rock-bottom.
Most investors demand the best preservation of capital from any possible market entry point to achieve a steady performance. MDD is defined as the peak-to-trough decline of an investment during a specific period and is usually quoted as a percentage of the peak value. It can be calculated based on absolute returns, in order to identify strategies that suffer less during market downturns, such as low-volatility strategies. More importantly, the MDD can also be calculated based on returns relative to a benchmark index, for identifying strategies that show steady out-performance over time. MDD Formula MDD (t) = (P – V(t)) ÷ P, for 0 < t < T Where: P: Peak value before largest drop V(t): The value before new high established Note: The absolute MDD can be obtained by selecting lowest V(t) in the MDD(t) formula. To compare MDD for a given portfolio against a relevant benchmark, investors can simply display MDD(t) values for the portfolio and its benchmark on the same chart (see an example shown below). 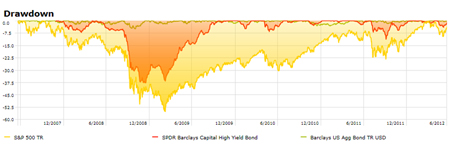
|
Up/Down Market Capture RatiosUp/Down Market Capture Ratios show you whether a given portfolio has out-performed or under-performed a relevant market benchmark during periods of market strength and weakness, and if so, by how much.
Up Market Capture Ratio for a portfolio is calculated by taking the portfolio's monthly return during months when the benchmark had a positive return and dividing it by the benchmark return during that same month. Down Market Capture Ratio is calculated by taking the portfolio's monthly return during the periods of negative benchmark performance and dividing it by the benchmark return. Portfolio managers can report the Up/Down Market Capture Ratios by calculating the geometric average for both the portfolio and its benchmark returns during the up and down months, respectively, over a given time period (say, 3-year or 5-year). An Up Market Capture Ratio over 100 indicates a portfolio has generally out-performed its benchmark during periods of positive returns for the benchmark. Meanwhile, a Down Market Capture Ratio of less than 100 indicates that a fund has lost less than its benchmark in periods when the benchmark has been in the red. An example with slightly better up market capture ratio and much worse down market capture ratio is show in the chart below. Dividing the down-market into the up-market ratio gives the overall capture ratio, which indicates how a portfolio performs against its benchmark. Up/Down Market Capture Ratio Formula Overall Market Capture Ratio = Up Market Capture Ratio ÷ Down Market Capture Ratio 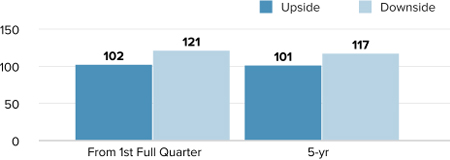
|

Up/Down Market Capture Ratios
|

Return vs. Risks (Volatility)
|
Return vs. Risks (Volatility)
Return (Annualized Total Return) is the geometric average amount of money earned by an investment each year over a given time period. It is calculated as a geometric average to show what an investor would earn over a period of time if the annual return was compounded.
For investors, Volatility is the degree of variation of a portfolio value series over time as measured by the standard deviation of returns. Standard deviation is a measure that is used in descriptive statistics to describe dispersion (also called variability) in a data set. Historic volatility is derived from series of past portfolio values. An easy way to understand way of measuring a portfolio's performance against its benchmark index is simply plot the annualized total return and the standard deviation of returns on the same chart. Sometimes multiple benchmarks may be plotted on the same chart to illustrate the portfolio's returns vs risks compromises (see an example shown below). A simple overall return/volatility ratio can be calculated to compare multiple portfolios and benchmarks at the same time. Return/Volatility Ratio (R/V) Formula R/V = (Annualized Total Return) ÷ (Standard Deviation of the Returns) 
|
Investment and Investor Behavior MeasurementAn investment and investor behavior diagnosis tool can help investors to measure the added value, if any, of their actively managed portfolios.
Three most important and simple performance benchmark measures are a portfolio's Maximum Drawdown, Up/Down Market Capture Ratio, and Return / Volatility Ratio. Investors can do a performance diagnosis for their own portfolio by examining the these important measures found in their portfolio performance reports prepared by the financial institution. The portfolio diagnosis process can greatly influence investors' decision to use an actively managed portfolio vs. a passive index fund or an ETF. If you believe that any other significant methods for portfolio performance diagnosis should be included here, please contact us. |
Investment and Investor Behavior Measurement
|